For more examples of visual tools in iSMS, see the Visual aids section on this documentation page.
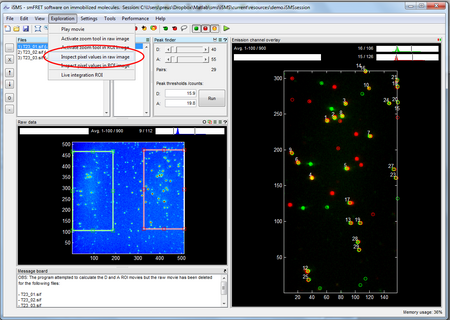
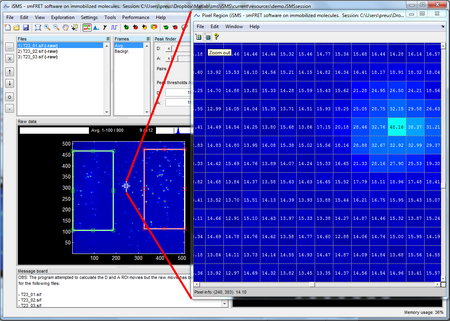
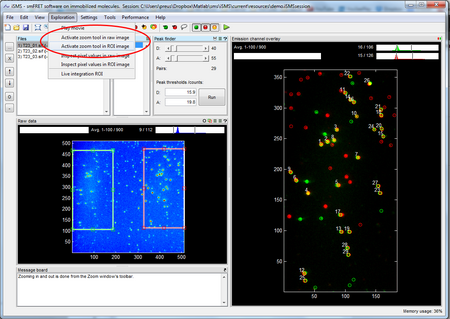
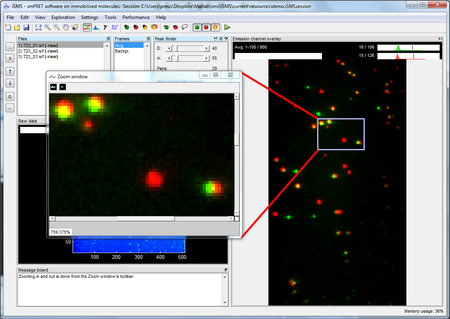
The zoom tool allows flexible zooming of regions with e.g. dense molecules.
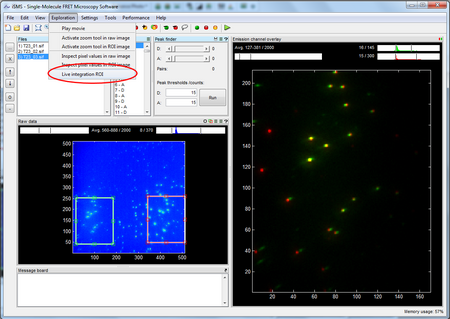
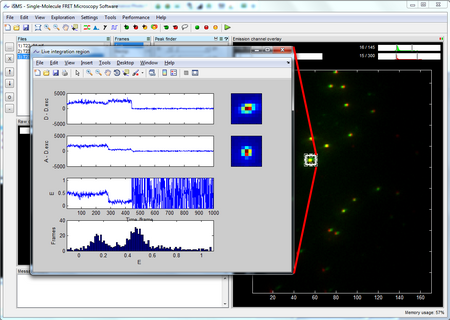
The 'Live integration ROI' allows you to dynamically inspect time traces and FRET-distributions of any region in the raw data.